The Metric of Nothing
Story Points Are Not The Answer
There's a pattern that keeps showing up in organizations trying to get better at planning that I've noticed. It doesn't happen always, but often enough. Someone at the portfolio level or similar looks at a dozen teams, all working on different products or a few very complex ones, all moving at different speeds, and asks some very reasonable questions:
"How do we know what our teams can handle? How can we ensure delivery is done as promised? Which team is struggling and why?"
Those are fair questions. The goal behind them is to prevent overload, to distribute work in a way that doesn't burn anyone out and keep the so-called work-life balance up. The intention is good. The need is real.
And the need isn't new either. Organizations have been trying to get answers to these questions for decades. But traditional estimation, whether in hours, days, or project phases, has never reliably delivered them. So when someone comes along and suggests an agile estimation method that's supposed to be so much better, of course people listen. And so the Agile Estimation Enters (in this case): Story Points. Maybe nobody quite remembers who brought the idea in. Maybe it was a consultant, maybe a conference talk, maybe it just showed up the way most things do in corporate environments: suddenly, but no one knows from where exactly. But the pitch sounded so compelling: a single metric, usable across all teams and departments, a Single Source of Truth for capacity, measurability, and planning. What's not to like?
Everything, as it turns out. This is a story about good intentions while using a tool in the most wrong way possible.
What Story Points Were Actually Meant For
The original idea was quite simple: When a team sits down in Planning and or Refinement, they need a way to talk about complexity. Not time, not effort in hours, but relative complexity. "This feature is about twice as complex as that one."
The Fibonacci sequence (1, 2, 3, 5, 8, 13...) was supposed to reflect increasing uncertainty. A 13 isn't exactly 13 units of anything. It's a signal that says "we don't fully understand this yet".
And that's it. A conversation starter between different competences within a single cross-functional team. An internal tool for one team to compare their own work items against another. Not a planning metric. Not a performance indicator. Not something you put on a dashboard and show to the stakeholders. This is crucial to understand: Story Points were never designed for what they're (most often) being used for today.
One team I worked with used the Fibonacci sequence "exactly" as intended: they'd estimate tickets and assign a number. But when I asked them during a Planning Session:
"what happens when a ticket gets estimated at 40 or higher points?",
they looked at me and said:
"Well, we write it down, and then at some point we work on it during our Sprint."
That was it. No splitting, no conversation about why it's that big, no action at all. The number went straight into their Ticket tool (in this case Jira), and life went on. The poor person who had to work on that ticket... The estimation had changed nothing about how the work was handled. It was just a number in a field. They did as they were told to do but nothing was explained further than that it seems.
And the portfolio level loves numbers. And the portfolio level needs visibility. That's where Velocity comes in. In Scrum, Velocity is the sum of all Story Points a team completes in a Sprint (time cycle for delivery for an increment of value). The idea was simple: if a team finishes 40 points this Sprint, that gives them a rough sense of what they might handle next Sprint. An internal reference point for one team, to ensure they find a balance. But the moment that number hits a spreadsheet and gets shared outside the team, everything can only go even more sideways from there.
More Ways It Goes Wrong
Once Velocity becomes visible to anyone outside the team, a bunch of things usually happen. They might not always happen, but the possibility of them is very high:
"Why did you deliver fewer points than last Sprint?"
Velocity becomes a performance curve that's only allowed to go up. A bad Sprint gets treated like a failure, not like a normal fluctuation in complex work. Teams learn quickly: the number needs to go up, or there will be questions. So the number goes up. Not because the team is delivering more, but because the estimates start inflating. Same work, higher points. The system incentivizes inflation.
"You should be able to deliver X points per Sprint!"
This is where it gets properly absurd. Someone takes the average Velocity from the last few Sprints, rounds it up a little, and sets it as a target. A target based on fictional numbers that the team made up during Planning Poker. That's not planning and especially not a planning based on an increment of value if that's pulled into conversation. That's fantasy math with a deadline!
"Why can't your team deliver as many points as Team Y?"

— Goodhart's Law
This is the one that makes Scrum Masters lose sleep. Team A estimates a login feature as a 13. Team B estimates the same feature as a 21. Neither is wrong, because Story Points are relative to each team's own context. Comparing them across teams is like comparing temperatures in Celsius and Fahrenheit and wondering why the numbers don't match. But the spreadsheet doesn't know that. And without that context, the numbers tell a misleading story. And let's not even mention the psychological effects it has on both teams, being rallied up against each other rather than working with each other.
The People in the Middle
The Scrum Masters (usually) see all of this happening. They know Story Points were designed for complexity discussions, not for Velocity tracking; simply to have conversations during Planning to improve the team's sprint plan. And then watch those numbers get pulled into portfolio reports to adjust quarterly promises. Completely turning it into something they were never meant to be.
The teams feel the pressure. They don't care about the theoretical distinction between complexity and effort. Someone above them is watching a number, and that number better make sense. So refinement stops being a conversation about the work and starts being a negotiation about the score. "Is this a 3 or a 13?" becomes less about understanding the task and more about what the Velocity chart needs to look good.
And the managers? They still don't have what they actually need. They wanted to understand capacity. Story Points don't measure capacity. They wanted to prevent overload. Story Points don't show workload. They wanted to plan across teams. Story Points aren't comparable across teams.
Everyone is frustrated. Nobody is getting what they need and want. And the system keeps running because nobody challenges the questions of the assumption underneath it all: that you need to estimate in the first place.
The Assumption We Have
Here's what makes this so persistent: the assumption that an agile estimation tool is required, that you can't plan without it or that it has to be used "to be agile".
And here's where it gets almost funny: Story Points were invented specifically to move away from traditional estimation. That was the whole point. Stop guessing hours, start talking about complexity. But what did organizations do? They took this agile tool and bent it right back into the thing it was supposed to replace: someone makes up a number, someone else writes it down, and the organization calls it a plan.
And the track record for that approach? In a study spanning over 20,000 software projects across 18 years, researcher Capers Jones found that more projects fail because of poor cost and schedule estimates than because of technical, political, or team problems combined. The Standish Group's CHAOS Report showed the same picture: only 16% of projects were delivered on time and on budget. That was in 1994. By 2020, the success rate had crawled up to 31%. Decades of trying, and we still can't get it right more than a third of the time. Traditional estimation never delivered. And now the agile version is being used to do the exact same thing. Irony much? These numbers don't prove estimation can't work. They prove it hasn't — at least not at the scale and reliability organizations need.
So, what if the problem isn't the estimation method? What if the answer isn't to estimate better, but to build a system where you don't have to estimate at all, because the data already tells you what you need to know?
Count, Don't Guess
Let's remember that Agile Estimation is a tool, like a tool used to hang a picture. The goal is to have the picture on the wall, not continuously use the tool for hammering nails into the wall.
If every ticket in your backlog could be anywhere from half a day to 26 weeks of work, then yes, you need some way to distinguish between them. But if every ticket is cut to roughly the same size, say about one working day (around 8 hours of work, but who even has 8 hours uninterrupted focus time?) then the only metric you need is: how many effort tickets does this team finish per week? That's not a fictional number. That's a count. Observable, objective, not game-able. (This works well for execution-level work. Research spikes, architecture decisions, and pure exploration are a different category, and they don't always fit into uniform sizes. But that's a topic for another day.)
In my own work, that meant replacing estimation ceremonies with cutting discipline. Instead of asking the team only "how complex is this?", the question also became "can this be done within five working days?" If yes, it's a good enough ticket. If no, it needs to be split further. No Fibonacci. No Planning Poker or T-shirt sizes. Just a clear threshold with cutting guidelines, based on an individual's competence to finish on the planned work. Five days is a useful default, not a universal rule. The right number depends on your context, your team's maturity, and the kind of work you're doing. Especially when teams work on multiple initiatives/projects and increments this is really helpful.
(Of course, this doesn't always end up with tickets staying in the system for only 5 workdays. The transparency needed here is, in what actual status has the work been (blocked maybe? Or waiting for feedback?). The goal is 5 workdays in the "in progress" status!)
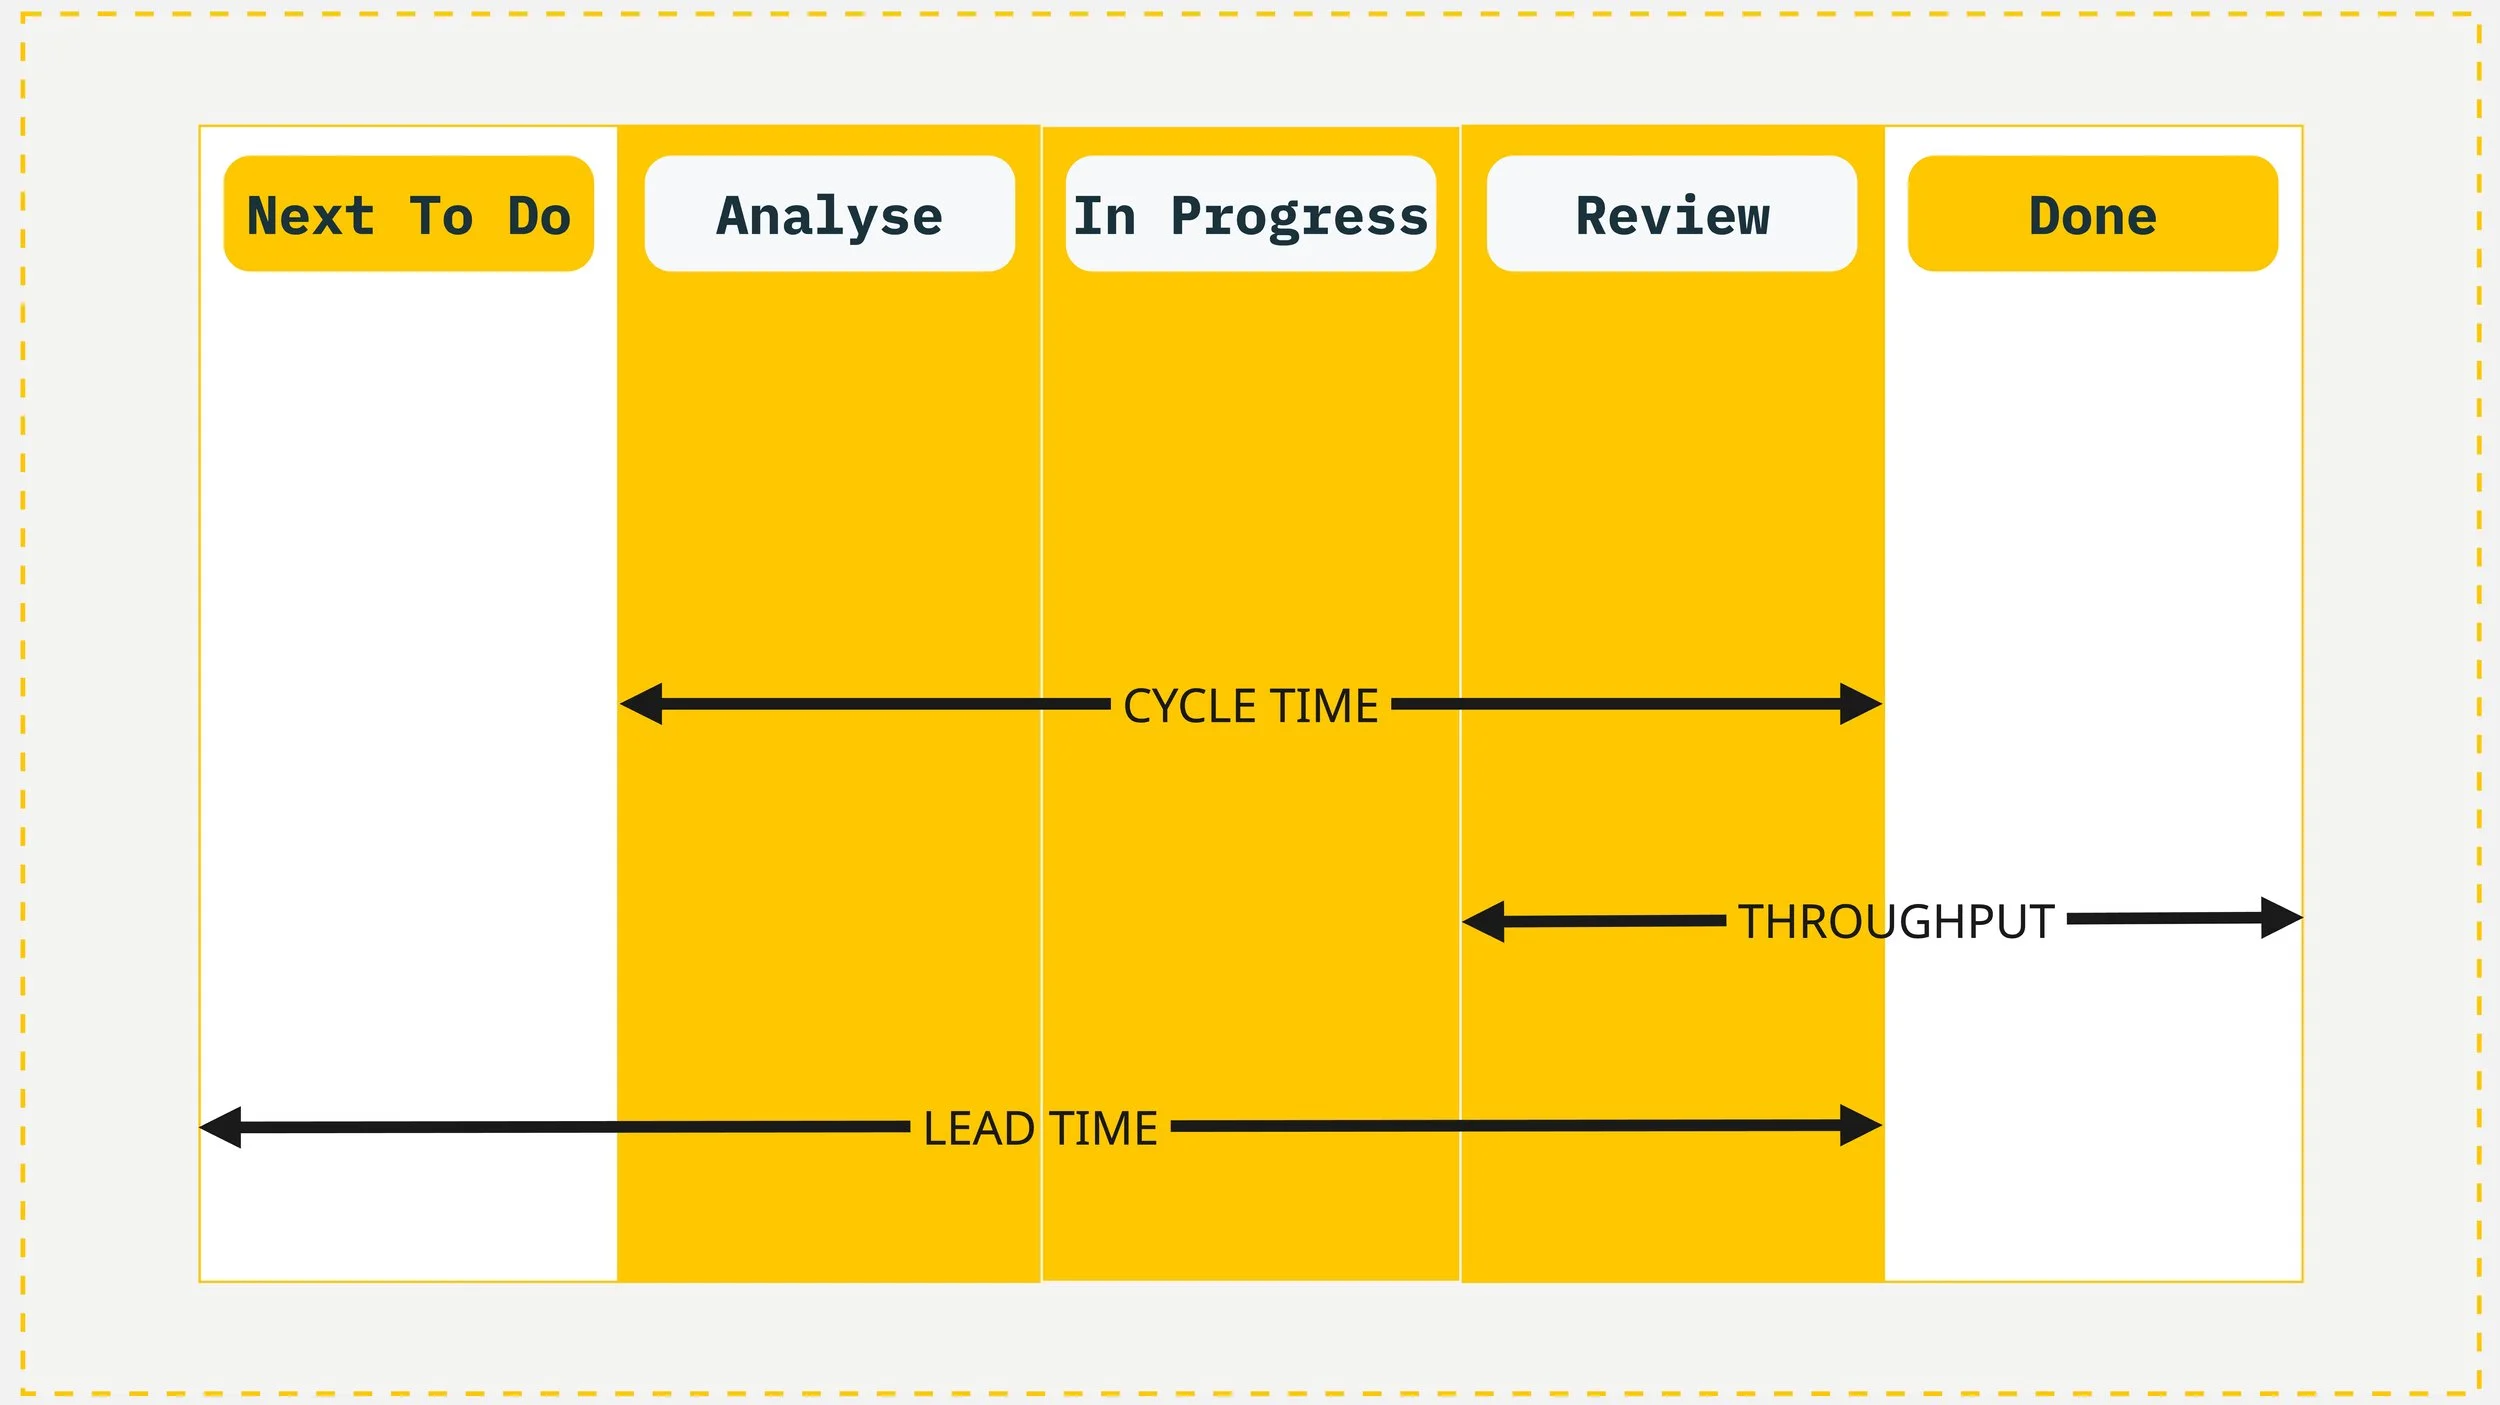
Example of a simple Kanban board and the metrics it can provide: Flow Metrics.
And for the portfolio level? Flow metrics.
Throughput: how many items does a team complete per week or specific time frame (call it a Sprint if you need to)?
Cycle Time: how long does a single item take from start to finish for the entire increment of value (no matter the delivery cycle)? Real numbers, based on real data, measured automatically by the tools you're already using. The system measures itself.
Lead Time: how long from the moment work is requested until it's delivered — including the time it spent waiting before anyone even started?
For all of this, the backlog hierarchy starts to matter a lot. The portfolio level typically cares about the increment level: what's the Cycle Time for a whole slice of customer value? When one increment of value consists of, say, 4 delivery packages with e.g 15 effort tickets each, and those tickets are all roughly the same size, you can see the timeline forming without anyone having estimated a single point. The data exists in tools like Jira already, it's just being overlooked in favor of made-up numbers. Often because the backlog structure that would surface it was never set up in the first place.
And when a ticket does exceed the 5-day threshold? That becomes a useful signal instead of a failure! Was it too big and should have been split further? Or is there a systemic issue: blocked by an external dependency, waiting on feedback, stuck because of a missing permission? Story Points would have told you nothing about why something took long. Cycle Time and Control Chart (in Jira) tells you exactly where to look. Maybe all tickets with a certain subject always take too long? Time to investigate.
When a manager asks "can this team take on more work?", Throughput gives a real answer. When someone asks "how long will this increment take?", historical Lead and Cycle Time gives a forecast based on what actually happened, not what someone guessed in a meeting.
This is what needs to be built with teams: a structure where the backlog hierarchy, the cutting rules, and the flow metrics work together so that estimation becomes unnecessary. Not because estimation is evil, but because good structure makes it redundant.
A Real Problem Underneath
Another thing that needs to be said: It will most likely very soon tell you that the problem is your dependencies, especially if your teams work within similar or dependent complex products. And most often they spend their time playing responsibility bingo.
Let's be very honest: how many teams actually work on just one Sprint Goal, one increment at a time? In larger organizations, that's a luxury most teams don't have. Scrum is clear about this: all necessary competencies need to be in the team. If that's not the case, Scrum isn't built for your situation. Unless you restructure your entire system around it. Or bring in a scaled framework. Neither of which tends to happen quietly, cheaply or fast.
Fix your transparency before you fix your metrics. Ask yourself honestly:
Are the people doing the work also the people deciding what to work on and how? Are they working together or just struggling to figure out what's going on in their bigger work items? Do they even know what bigger visions or OKRs (Objectives and Key Results) they are trying to fulfill?
And most importantly: is it part of your backlog — not somewhere hidden in a PowerPoint?
If the answer is no (or even just a maybe), that's your actual problem. Not the agile estimation method.
The need at the portfolio level was right all along. Understanding capacity. Protecting teams. Planning with confidence. The tool picked for the job just wasn't built for it.
The better question isn't "how many points can my teams deliver?" It's "how many things does this team actually finish, and how long does each one take?" Remembering that it should be very clear why work exists in the first place and what everyone needs to do for it.
That's the difference between planning on estimates that lost their context and planning on data that speaks for itself. Most of the time, the answer starts with: your backlog structure.
If this sounds familiar — whether you're a team wondering if you still need Story Points, or a manager looking for metrics that actually answer your questions — feel free to get in touch for a free consultation call: